
The main Proxifier window looks like following:
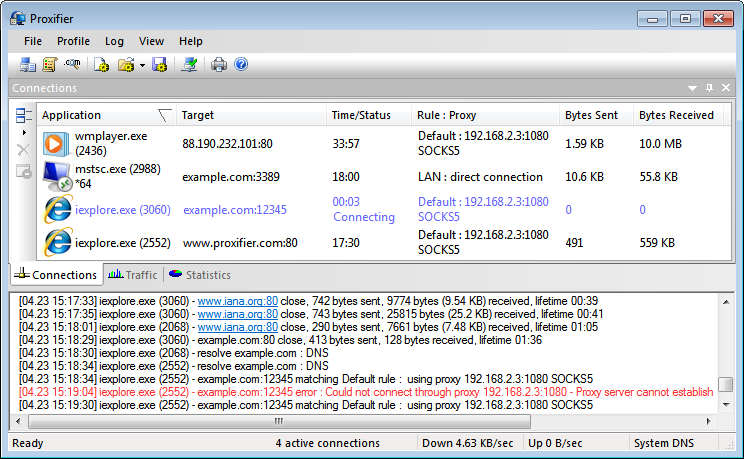
Four main parts are Connections, Traffic, Statistics and Output. The first three are panes so you can adjust their layout, drag-and-drop, dock, hide, close, etc.
To enable/disable the panes use the View->Windows menu. The layout is saved through the restart of Proxifier.
You can reset the entire layout with View->Reset Layout command.
Connections
In this window you can see a list of active connections handled by Proxifier with status. The information about each connection is divided into the following groups (columns):
- Applications — program name, process ID (if verbose output is enabled), “*64” mark for 64 bit applications.
- Target — target host address (DNS name or IPv4/IPv6) and port number.
- Time/Status — time elapsed from the last status change. Available statuses are Connecting (blue), Closed (gray), Failed (red) and Canceled (red). No status is displayed for an active connection.
- Rule - Proxy — rule name and proxy address with the protocol or chain name. If no proxy is assigned “direct connection” is displayed.
You can sort the list by any of these parameters with a click on the corresponding column header.
On the left hand side of the window there is a toolbar with three buttons. You can use it to change the size of the list elements, to close a connection or to terminate a process. The same options are available in the context menu (right-click).
Traffic
The Traffic pane allows you to view the graphic presentation of the data on the amount of information being transferred.
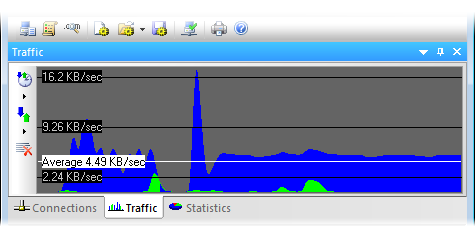
The blue represents incoming traffic, and green is outgoing traffic. The horizontal black lines indicate the levels of the data transfer rate. The white line indicates the average transfer rate for the displayed period of time.
With the corresponding toolbar buttons or the context menu (right-click) you can change the update rate, specify the type of the graph, and clear it.
Statistics
This pane shows various statistics on the work of Proxifier: the number of connections processed by the program (active, failed, total), the quantity of sent and received bytes, and the time Proxifier has been working. With the corresponding toolbar buttons or the context menu (right-click) you can copy the statistics to the clipboard or reset all counters.
Output
Here Proxifier outputs (logs) all message in real time. Each entry can contain the following information:
- Time/date in the following format [MM.DD HH:MM:SS].
- Application name with optional x64 mark and process ID.
- Target (hostname or IPv4/IPv6 address).
- Event description (e.g. connection opened/closed, resolve, error, etc.)
- Additional information like connection statistics or error code.
You can change verbosity of the output at Log->Output Level menu.
Three levels are available:
Three levels are available:
- Error only — errors and program critical messages only.
- Normal — errors and connection related messages (open/close). Recommended for the majority of cases.
- Verbose — outputs all messages. This includes rule processing, DNS requests and others. Can be useful for debugging purposes.
It is possible to write the output into a log-file with the Log->Log Level menu.
Miscellaneous
Proxifier can be hidden to the System Tray when the main window is closed (View->Icon in the System Tray).
At the bottom of the main window there is a special information area called the Status Bar. Here you can see the number of active connections, transfer rates and DNS status.
Proxifier supports various visual styles. You can change the style at View->Application Look.
No comments:
Post a Comment